Built-in Analytics
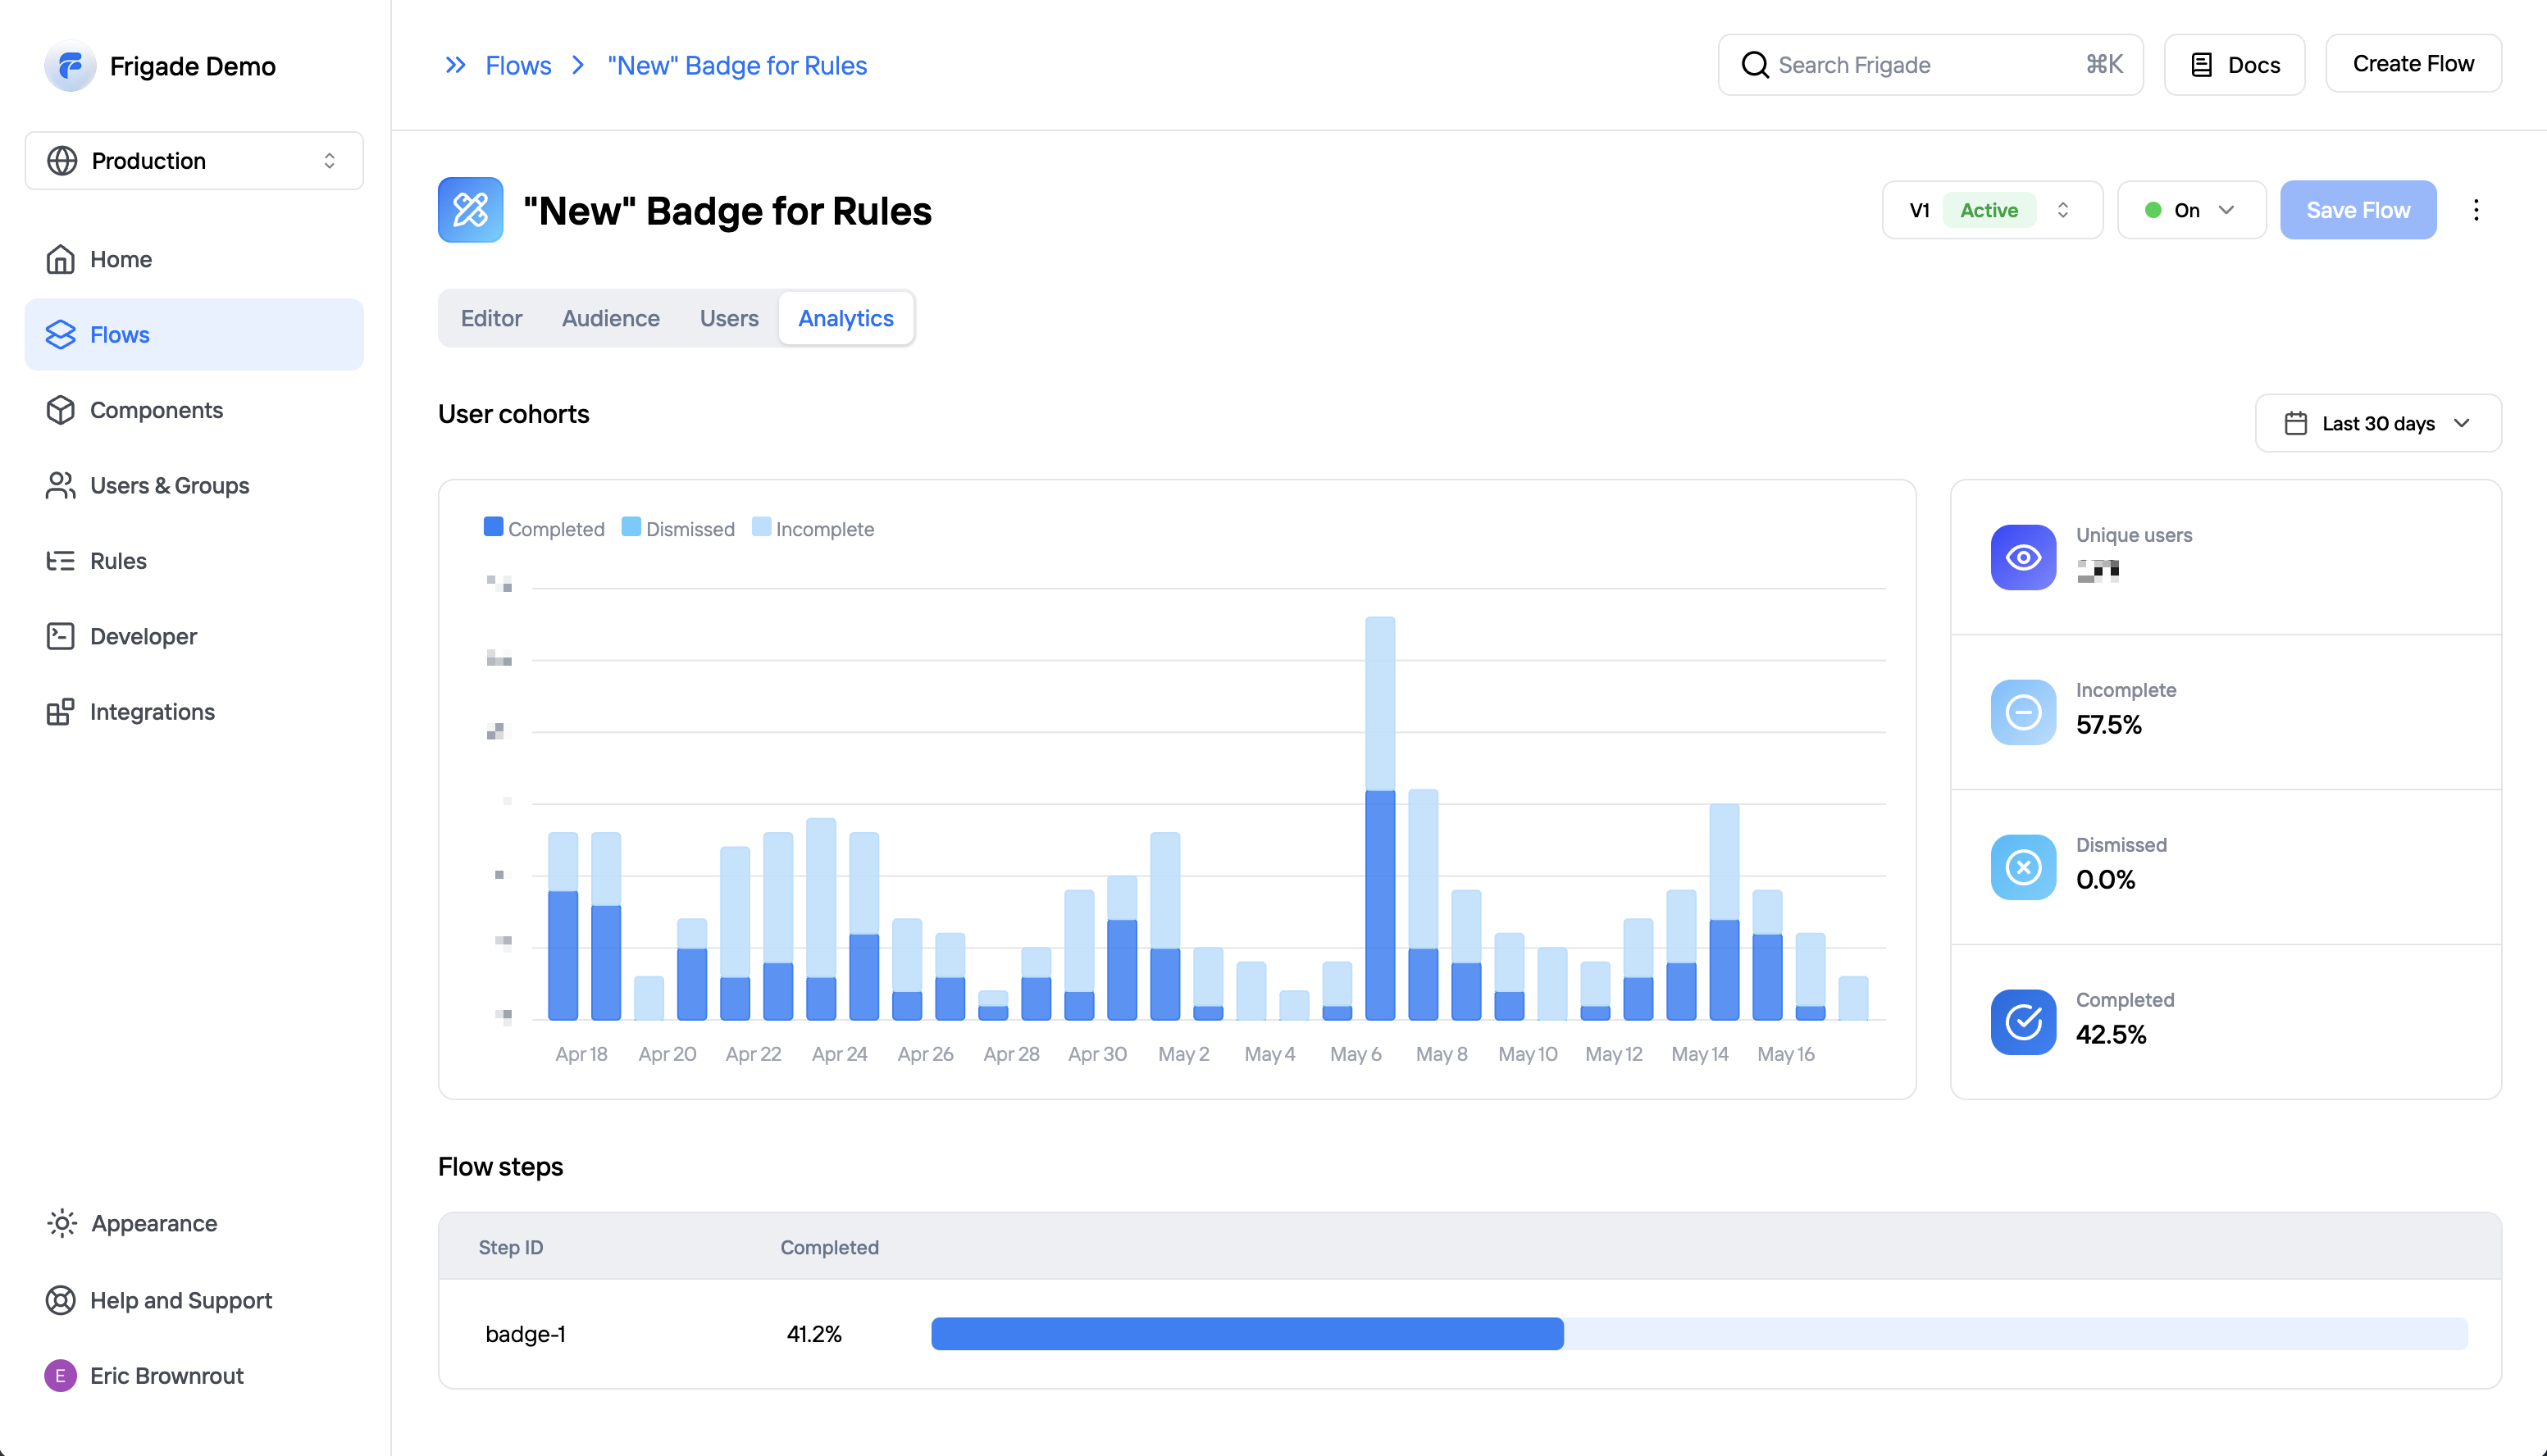
Frigade provides built-in funnel analysis to help you understand the performance of your Flows. Frigade will automatically track how many users have interacted with a Flow and how many have completed it. You can also see how many users have dismissed or quit a Flow.
Flow cohorts
Frigade analytics are based on user cohorts. Frigade will group users into daily cohorts based on the date they first interacted with the Flow. You can see detailed breakdowns by hovering on any given day in the graph. Statuses include completing the Flow, dismissing or quitting the Flow, or not yet completing the Flow.Time windows
You can change the time range for the stats by clicking on the dropdown in the top right corner of the analytics page. You can choose betweenLast 7 days, Last 30 days, or All time. The metrics on the right side represent the totals for the selected time window, and the graph and step completion rates below will also adjust to the selected time window.
Flow versions
Each time a new version of a Flow is published it will its own analytics. This allows you to review the performance of different versions of the same Flow over time.External Analytics
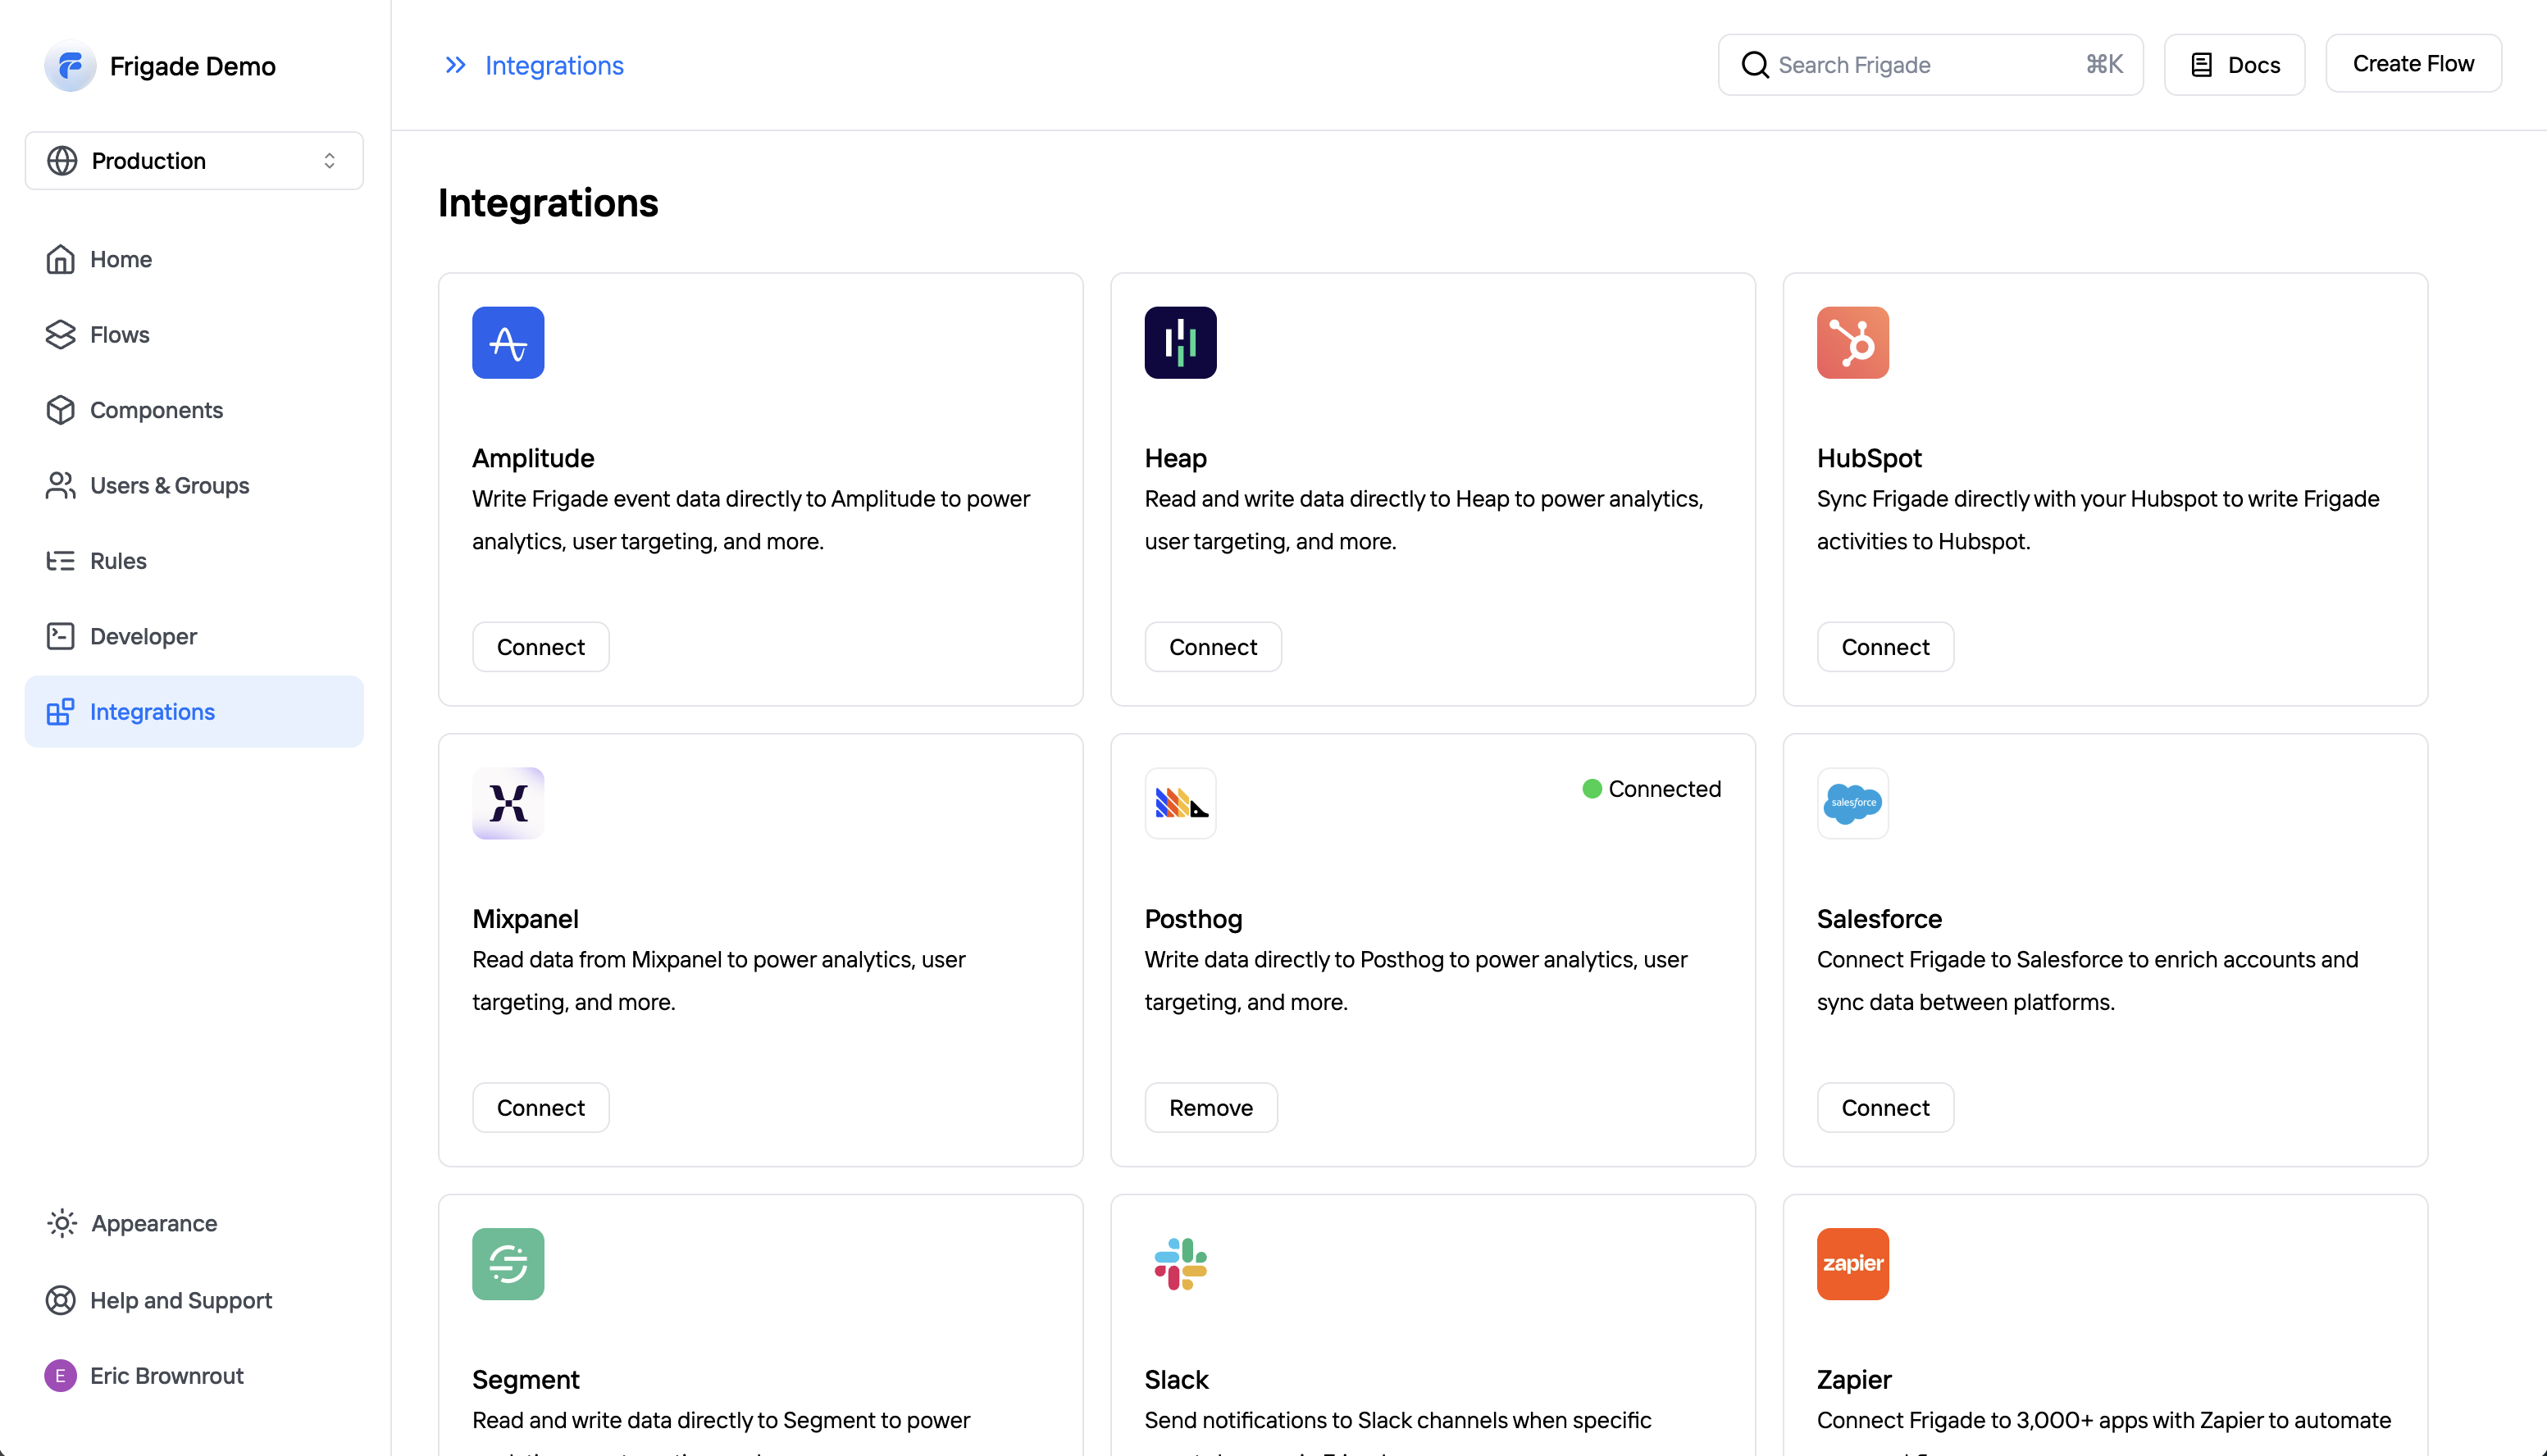
You can send Frigade tracking events to an external analytics platform for dashboards and reporting. Check out the integrations section to see our supported platforms. Additionally, you can always connect Frigade to the analytics platform of your choice using webhooks. See the webhooks documentation for more information.